Glossary Charts (MLS 2026)
The:
👉 Glossary Chart System
tracks historical labor performance and pricing information for:
•labor glossary services
•labor charges
•flat-rate times
based on:
•glossary code
•vehicle year
•manufacturer
•model
This information allows management to:
•review historical service trends
•compare pricing
•analyze labor times
•standardize estimates
•improve consistency
throughout the workorder process.
The Chart system acts as:
👉 a historical labor analysis database
built directly from your actual shop activity.
Automatic Chart Creation
The Glossary Chart is:
👉 automatically updated
during:
👉 Daily Closing.
As workorders are completed:
•labor charges
•labor units
•vehicle information
are analyzed and incorporated into the chart history.
If:
👉 no chart entry currently exists
for a specific combination of:
•labor glossary code
•vehicle information
MLS 2026 automatically creates:
👉 a new chart record.
This process requires:
•no manual data entry
•no operator intervention
during normal operations.
What The Charts Track
The Glossary Charts track:
•number of services performed
•labor charges
•flat-rate times
•vehicle-specific service history
This allows the business to see:
•what was actually charged
•how long jobs actually took
•how pricing varies by vehicle type
over time.
Rebuilding Charts
MLS 2026 also provides:
👉 a Chart Rebuild Utility
located under:
👉 Glossary → Rebuild
This utility completely regenerates:
👉 the labor chart database
from existing historical workorder information.
Why Rebuild Charts?
Rebuilding Charts is useful when:
•historical data needs recalculation
•older service data should be excluded
•pricing analysis needs refinement
•chart records become outdated
•management wants more current averages
Beginning Date Selection
When rebuilding charts:
👉 the system asks for:
•a Beginning Date
Only workorder activity:
👉 on or after that date
is included in the rebuilt charts.
This is important because:
•labor rates change over time
•shop pricing evolves
•older history may no longer be relevant
Many businesses rebuild charts annually using:
👉 more recent historical ranges
to maintain:
•realistic averages
•current labor standards
•modern pricing analysis
Important Rebuild Recommendation
⚠️ Chart rebuilding can process very large amounts of data.
It is strongly recommended that:
👉 the rebuild utility be run:
•overnight
or
•when no users are actively using the system.
This prevents:
•network slowdowns
•user interruptions
•performance issues
during processing.
Editing Charts
Existing chart entries may be reviewed and edited from:
👉 Glossary → Charts
The chart editor displays:
•all current chart records
•vehicle information
•pricing statistics
•labor time statistics
for review and maintenance.
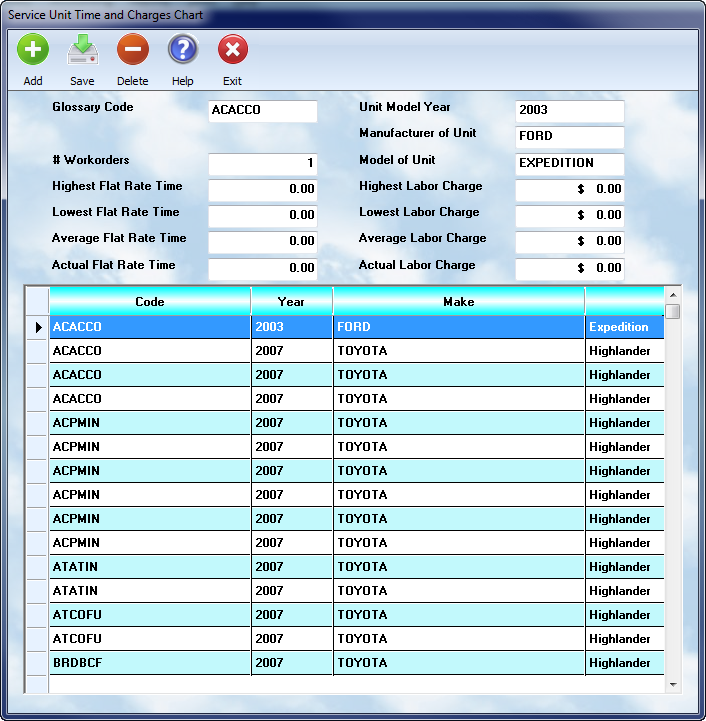
Glossary Code
The:
👉 Glossary Code
matches the code used in:
👉 the Labor Glossary system.
Charts require:
👉 at least an exact match
on the labor glossary code in order to accumulate history correctly.
This allows MLS 2026 to organize historical statistics around:
👉 specific service operations.
Actual Number Of Services
This field displays:
👉 the exact number of times
the service has been performed within the selected historical range.
If the chart is rebuilt:
👉 the count reflects ONLY:
•the records included
•within the selected rebuild date range.
This helps management understand:
•service frequency
•repair trends
•common operations
within the business.
Vehicle Identification Data
The chart also stores:
•vehicle year
•manufacturer
•model
for each matching service history group.
This allows:
👉 vehicle-specific analysis
because:
•labor times vary
•procedures differ
•service complexity changes
between different vehicles or serviced products.
Labor Charge Statistics
MLS 2026 automatically tracks:
👉 labor charge history
for matching:
•glossary codes
and
•vehicle criteria
The system calculates:
•Highest Labor Charge
•Lowest Labor Charge
•Average Labor Charge
This helps management:
•evaluate pricing consistency
•compare estimate accuracy
•identify underpricing
•standardize service charges
Flat Rate Time Statistics
MLS 2026 also tracks:
👉 labor unit history
for matching services.
The system calculates:
•Highest Flat Rate Time
•Lowest Flat Rate Time
•Average Flat Rate Time
This helps management:
•refine labor standards
•evaluate technician productivity
•improve estimating accuracy
•analyze difficult repair patterns
Actual Flat Rate Time & Labor Charge
The:
👉 Actual Flat Rate Time
and
👉 Actual Labor Charge
fields are:
⚠️ NOT automatically calculated.
These values are:
👉 management-controlled reference values.
They allow management to specify:
•preferred labor standards
•desired pricing
•shop-standard charges
for specific services and vehicle combinations.
These values may then be used as:
•estimating references
•service standards
•pricing guidelines
within the business.
Why Glossary Charts Are Valuable
The Chart system gives management:
👉 real-world operational history
based on:
•actual completed workorders
•actual labor charges
•actual labor times
rather than relying entirely on:
•generic labor guides
•estimated standards
•outside pricing references
This allows:
•more accurate estimating
•better labor analysis
•improved consistency
•stronger profitability management
throughout the operation.
Typical Uses For Charts
Businesses commonly use Charts to:
•review historical repair pricing
•compare technician labor times
•improve estimate accuracy
•establish standardized labor charges
•identify unusual repair patterns
•monitor profitability trends
•evaluate recurring service operations
Recommended Best Practices
When using Glossary Charts:
•Rebuild charts periodically
•Use recent date ranges when appropriate
•Review averages regularly
•Analyze unusual labor trends
•Verify glossary code consistency
•Standardize labor charges where possible
•Use actual historical data for estimating
•Run rebuilds during off-hours
Recommended Companion Sections
This section works closely with:
•Glossary Concepts & Coding Structure
•Labor Glossaries
•Kits
•Workorders
•Estimates and Invoices
•Labor Pricing
•Reporting Systems
•Daily Closing Procedures
Together, these sections provide a complete historical labor analysis and estimating workflow within MLS 2026.